Blog series Maps and views blog
Author Nick Dykes, British Library
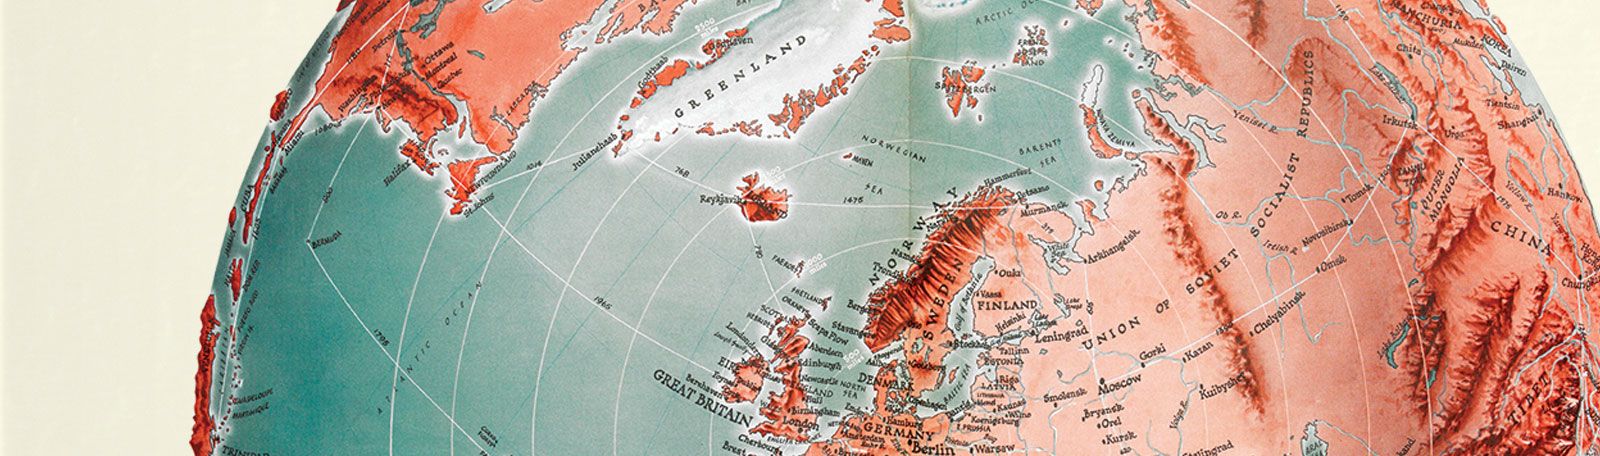
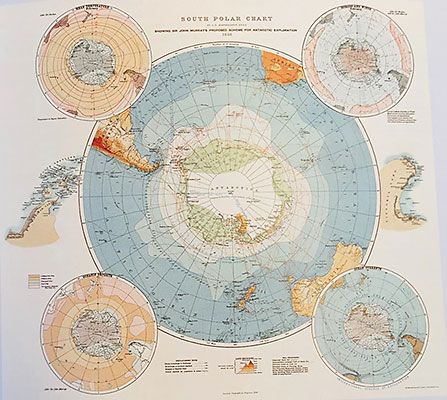
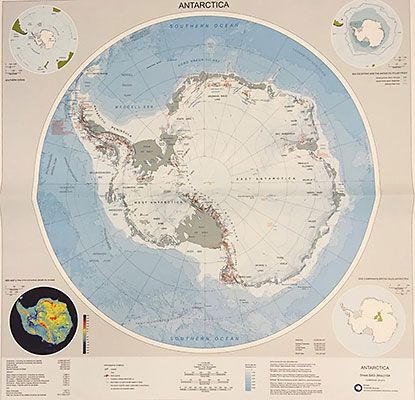
Antarctica presents many unique challenges to cartographers: as the last continent to be explored, its vast landmass – half as big again as Europe – is largely inaccessible, covered by sheets of mostly featureless ice, and shrouded in perpetual darkness for half of the year.
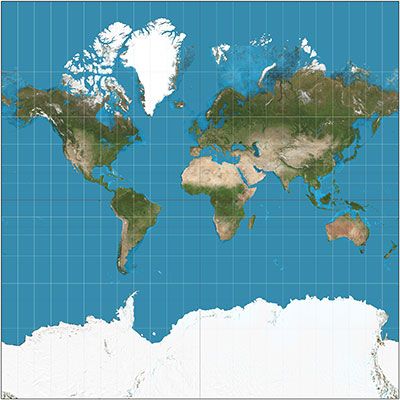
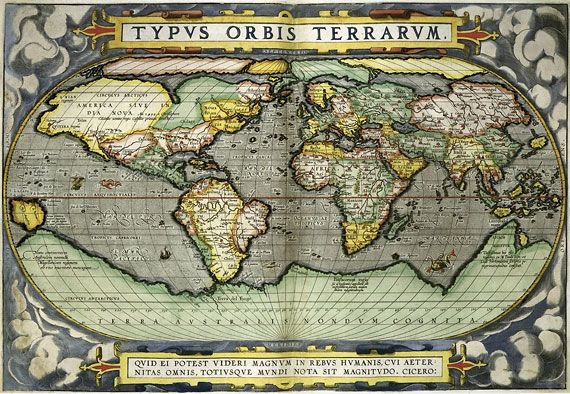
Stuck awkwardly at the bottom of the conventional world map, Antarctica is poorly served by many map projections, which distort it out of recognition. On occasion, its lack of military or geopolitical significance has provided a convenient excuse to leave it off the map entirely, as seen in the United Nations logo. Yet this image of the continent created by the Mercator projection does bear a surprising, if superficial, similarity to some of its earliest depictions, long before it was discovered.
.jpg?auto=format)
.jpg?auto=format)
.jpg?auto=format)
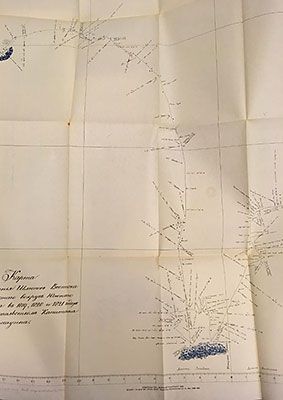
![Maps showing Southern Journey Party [left] and South Magnetic Polar Party [right], in the Geographical Journal 1909 Vol 34 no 5](https://www.bl.uk/images/v5dwkion/production/19d94cb197774a701a3347254602f6b86ea810ff-565x400.jpg/bl-maps-159..jpg?auto=format)
.jpg?auto=format)
.jpg?auto=format)
.jpg?auto=format)
,-2018.-[shelfmark-yet-to-be-allocated].jpg?auto=format)